
Figure 3.
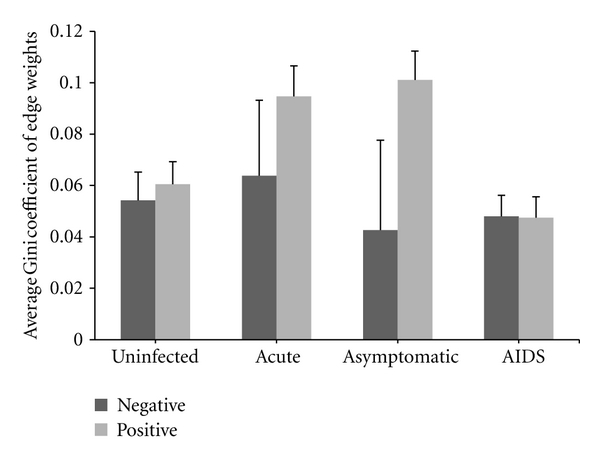
Average Gini coefficient of positive and negative edge weights for genes in GCNs. “Negative” and “Positive” represent the negative and positive edge weights, respectively.
Official websites use .gov
A
.gov website belongs to an official
government organization in the United States.
Secure .gov websites use HTTPS
A lock (
) or https:// means you've safely
connected to the .gov website. Share sensitive
information only on official, secure websites.
Average Gini coefficient of positive and negative edge weights for genes in GCNs. “Negative” and “Positive” represent the negative and positive edge weights, respectively.