Figure 2.

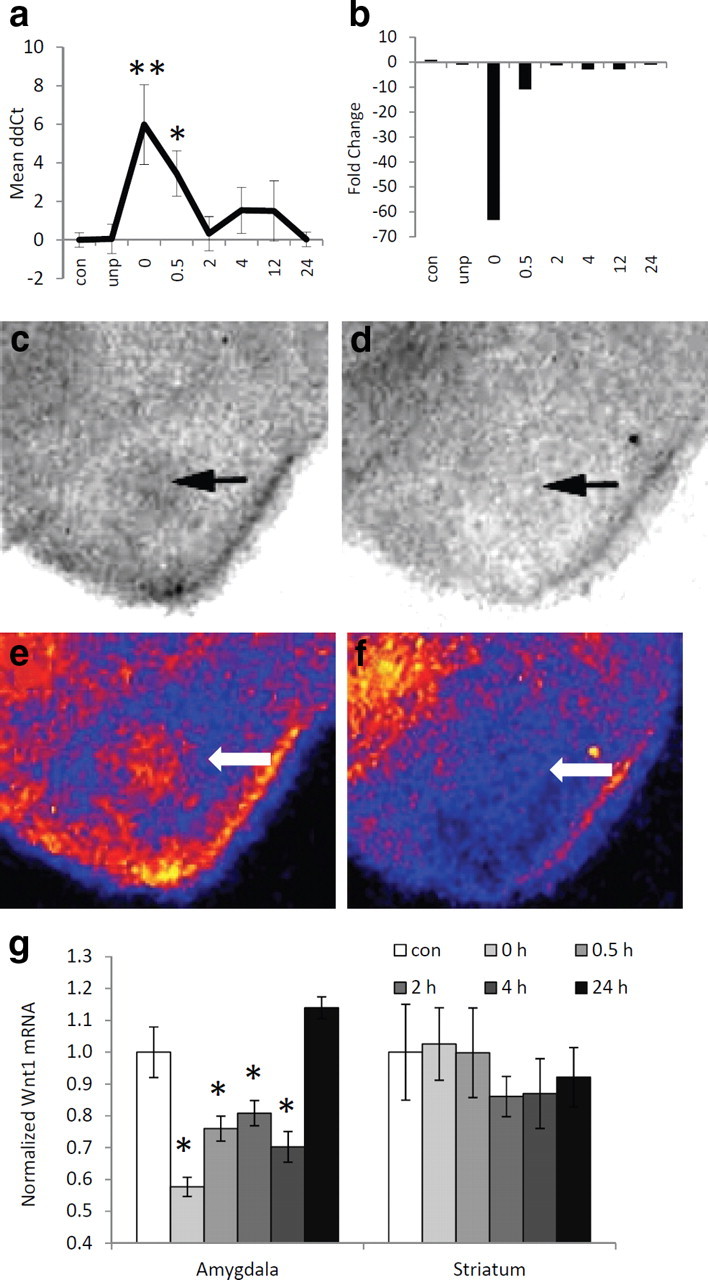
Wnt1 mRNA expression in the amygdala. a, Quantitative RT-PCR data showing the mean ΔΔCt values ± SEM across different conditions. Note that at the 0 (immediate) time point after fear conditioning, detecting the Wnt mRNA signal took on average six PCR cycles more than in the control and unpaired conditions. b, The same data as in a presented as mean fold upregulation or downregulation of Wnt1 mRNA compared to context-exposed mice. n = 14 for context, 7 for unpaired, 11 for 0 and 0.5 h, 12 for 2, 4, 12, and 24 h. *p < 0.05, **p < 0.01, ANOVA with LSD post hoc analyses. c, d, Autoradiography images of 35S-labeled Wnt1 riboprobe hybridized, in situ, to amygdala from mice killed immediately after training (d) or after context exposure (c). e, f, Pseudocolored images of c and d, respectively. Yellow, Highest expression; blue-black, lowest expression. Arrows point to amygdala. g, Relative expression of Wnt1 mRNA in the amygdala and striatum, normalized to expression in context-exposed mice. n = 8 per group. Data are mean ± SEM; *p < 0.01, ANOVA with post hoc analyses.
