Figure 4.

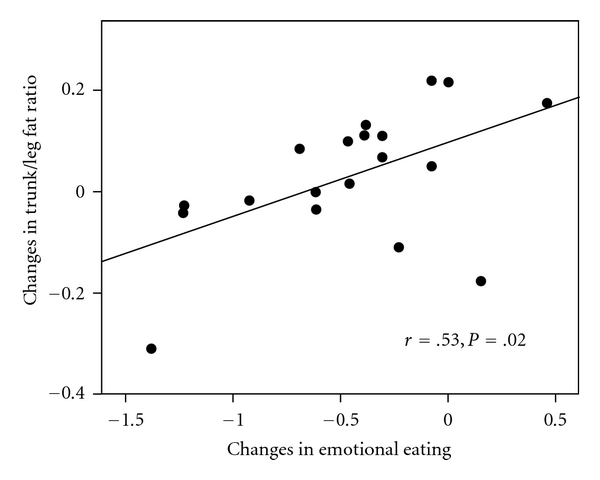
Scatter plot of correlation between changes in emotional eating and changes in trunk to leg fat ratio among treatment group participants.

Scatter plot of correlation between changes in emotional eating and changes in trunk to leg fat ratio among treatment group participants.