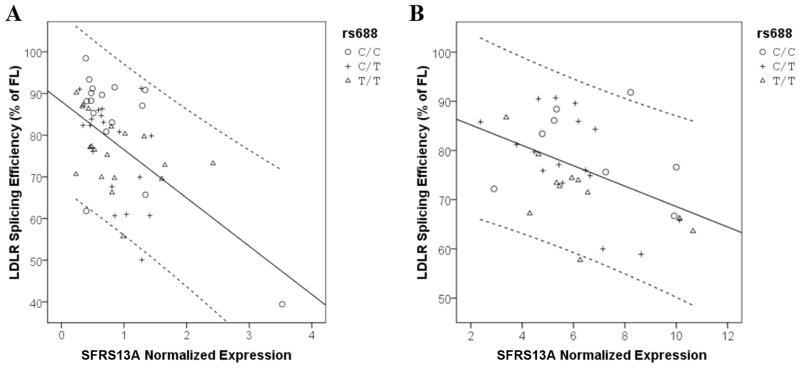
Figure 4. SFRS13A and rs688 are associated with LDLR splicing efficiency.
The relationship between LDLR splicing efficiency, SFRS13A expression and rs688 genotype are shown. As expression level of SFRS13A increased, the splicing efficiency of LDLR decreased. (A) In brain, specimens included 16 rs688C/C, 18 rs688C/T, and 19 rs688T/T. The r2 for the model is 0.309. (B) In liver, specimens included 8 rs688C/C, 16 rs688C/T and 15 rs688T/T. The r2 for the model is 0.213. The solid lines represent fit lines and the dashed lines represent 95% confidence intervals.

