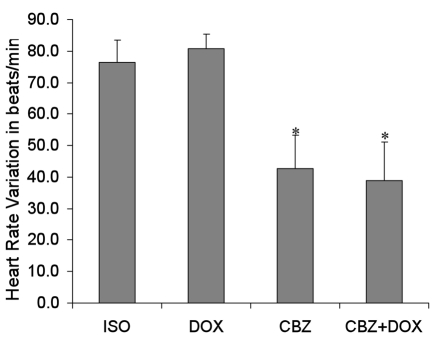
Figure 3.
HR variation over the course of the experiment (average+SEM) of mice receiving ISO, or ISO+DOX, ISO+CBZ, or ISO+DOX+CBZ. HRs were measured at the beginning of the experiment and one day before the sacrifice. Each HR is the average of 3 measurements. The experiment lasted ten days. The one-way ANOVA P value is 0.007 and indicates differences in groups (n=5). A Newman-Keuls test led to the conclusion that groups can be classified as follows: ISO=DOX>CBZ= (CBZ+DOX. *Indicates significant differences.

