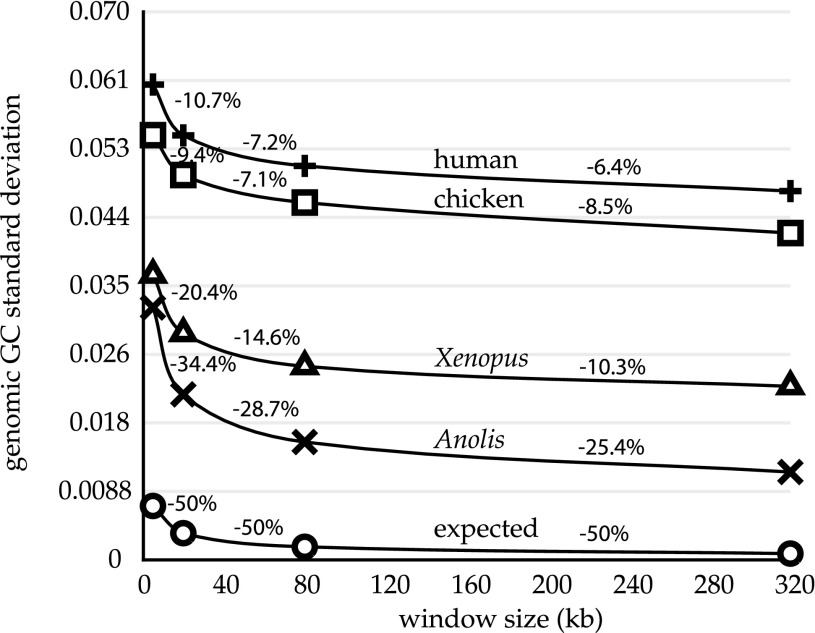
FIG. 2.
Observed and expected reduction of genomic GC spread for increasing window size. SDs were calculated for increasing window lengths (x axis) in human (+), chicken (□), Xenopus frog (Δ), and Anolis (×). The expected curve (O) is based on calculations from human mean GC content (see Materials and Methods), but it is nearly identical for those of the other genomes.

