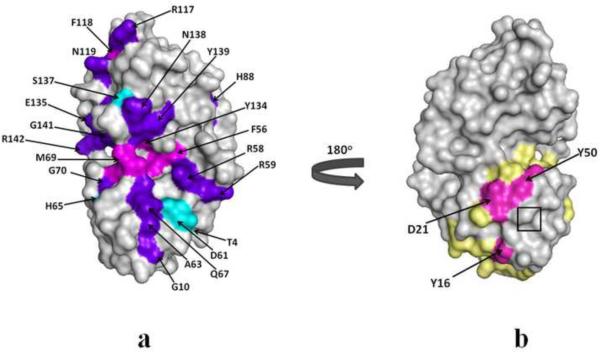
Fig. 7.
Molecular surface representation of HGD and P23T showing chemical shift perturbations as a result of interactions with Bis-ANS. (a) purple-blue indicates common residues showing interactions with Bis-ANS in both the proteins; cyan and magenta represent residues only in HGD and only in P23T, respectively, which interact with Bis-ANS. (b) A distinct surface patch (magenta) containing Y16, D21 and Y50 in P23T. The predicted hydrophobic patches14 (light yellow) are shown for comparison. The mutation site is shown in the boxed region in (b).

