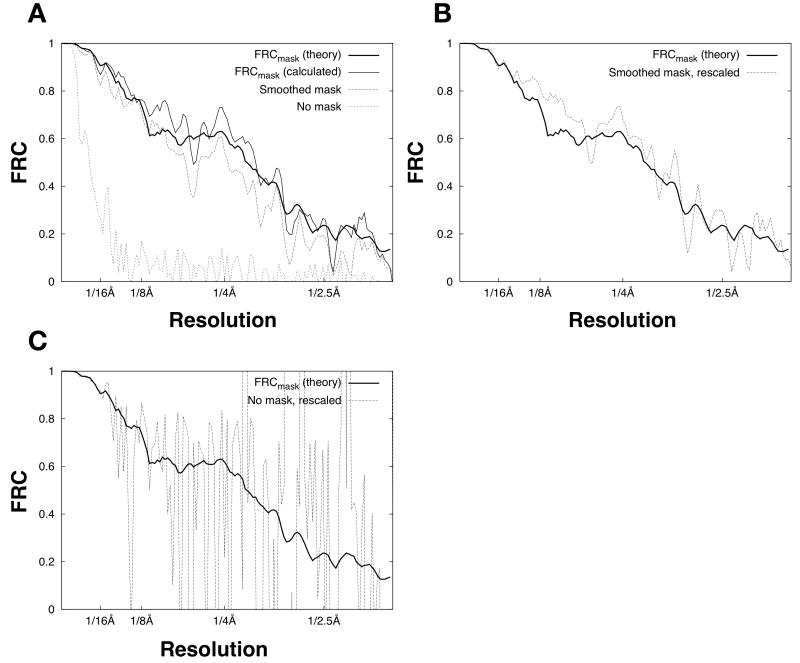
Figure 5. Estimation of the PSSNR from masked FRC calculations.
A. FRC calculations for a 100-image data set (as in Fig. 2), split into halves and averaged to produce two noisy particle estimates. In the masked FRC calculations, we applied either a binary mask (identical to Figure 3B) or a smoothed mask. The smoothed mask was obtained by expanding the border of the binary mask with a cosine-edge smoothing function (Grigorieff, 2007) such that 〈env2〉 increased by approximately 50%.
B. FRC calculations from A, but with the smoothed-mask calculation rescaled by Equation (19).
C. FRC calculations from A, but with the non-masked calculation rescaled by Equation (19).

