
Fig. 2.
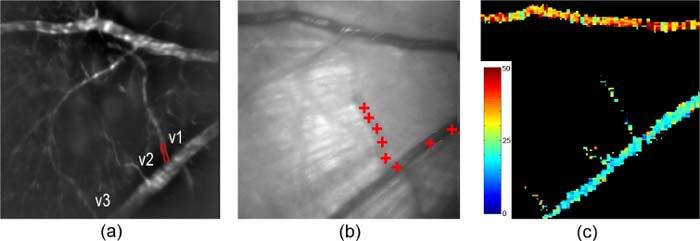
(a) Fluorescein angiogram with draining retinal venules labeled; edges of a venule (v1) are outlined; (b) Red crosses overlaid on the retinal image indicate the positions of a microsphere traversing a venule (v1) and major vein, visualized over 8 consecutive images; (c) An enface PO2 map depicting values in a segmented major retinal artery, vein, and venules. Color bar displays PO2 in mmHg.