Fig. 4.

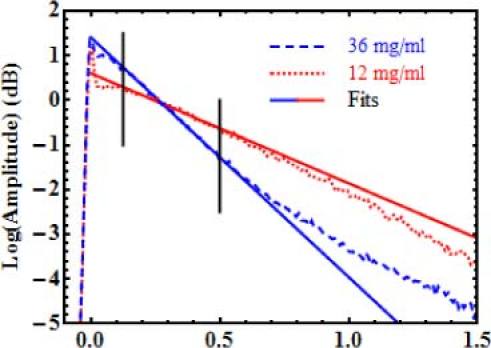
Examples of averaged OCT profiles and their fits. Samples have 0.3 mg/ml of carbon black. Alumina concentrations are 12 and 36 mg/ml. Only data between the vertical lines is considered in the fit.

Examples of averaged OCT profiles and their fits. Samples have 0.3 mg/ml of carbon black. Alumina concentrations are 12 and 36 mg/ml. Only data between the vertical lines is considered in the fit.