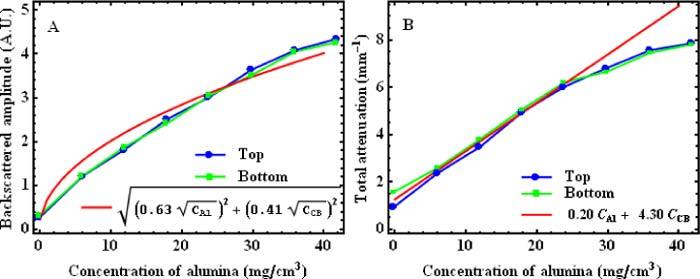
Fig. 5.

Plots of backscattered amplitude (A) and total attenuation coefficient (B) for a batch of 8 calibration samples having concentrations from 0 to 42 mg/ml of alumina and a fixed concentration of 0.3 mg/ml of carbon black. Each plot shows values obtained from OCT measurements performed on the top (blue circles) and the bottom (green squares) of calibration phantoms; and the fitted concentration dependencies (red lines) (CAlu: concentration of alumina; CCB: concentration of carbon black; A. U.: Arbitrary units)
