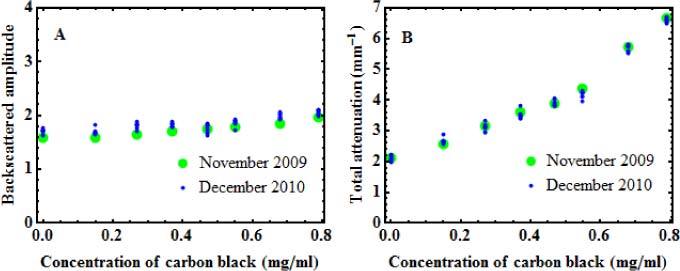
Fig. 9.

Backscattered amplitudes (A) and total attenuation (B) measured 13 months apart on a batch of calibration phantoms with increasing concentration of carbon black and fixed concentration of alumina (10 mg/ml). For the November 2009 series, measurements performed in a single region are shown (green dots), while for the December 2010 series, measurements performed in 9 different regions are shown (blue dots).
