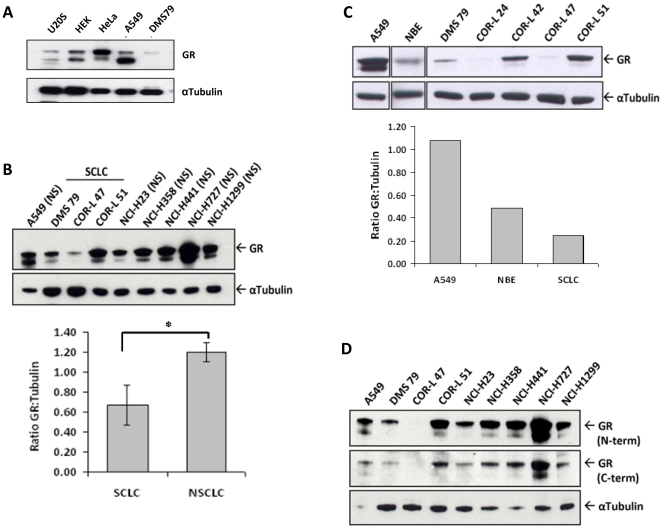
Figure 1. GR expression is decreased in the SCLC cells compared to non-SCLC cells and bronchial epithelial cells.
(A) Western blot analysis of GR, and tubulin protein expression in U20S, HEK, HeLa, A549 and DMS 79 cells. Blot is representative of 3 separate experiments. (B) Comparison of GR protein expression between SCLC, and non-SCLC (NS) cell lines. Quantitation of GR expression relative to tubulin is presented as mean +/− S.E.M. (n = 3) with * indicating p<0.05, Student's t-test for independent samples. (C) Comparison of GR protein expression in normal human bronchial epithelium (NBE) compared to non-SCLC cell line (A549), and a panel of human SCLC cell lines. Quantitation of GR expression relative to tubulin is presented. Mean of n = 2. (D) Analysis of GR protein expression using a pan-GR antibody raised against the GR N terminal (N-term), and a GRalpha specific GR antibody raised against the C terminal (C-term).

