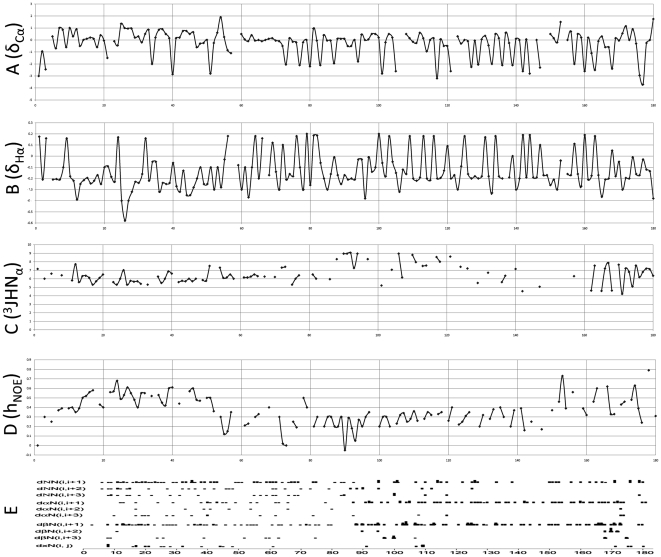
Figure 3. Summary of chemical shift deviations, J-couplings, heteronuclear NOEs and inter-residue NOE signals.
(A and B) δCα and δHα chemical shift differences were obtained by subtracting published amino acid residue average chemical shifts (BMRB Database Statistics) from measured Cα and Hα chemical shifts of amelogenin assigned amino acid residues. C, JHNα(3) coupling values of amelogenin amino acid residues. D, Summary display of heteronuclear NOE values. The L15-W45 regions featured average NOE values of 0.6 while the central regions of the amelogenin molecule displayed NOEs between 0.5 and −0.2 (0.3 average), suggesting that the L15-W45 region contained a relatively rigid structure while the M1-N14 and L46-D180 regions were more flexible in comparison. E, Summary display of Interresidue NOE signals. The interresidue NOEs were classified into dNN, daN and dbN signals and each class included (i, i+1), (i,i+2) and (i, i+3) subcategories. dαN(i,i+1) and dβN(i,i+1) signals were denser between amino acids 100 to 170. Interresidue NOEs equal to or more than four amino acids apart (dxN(i, j)) and interresidue NOE that were three amino acid apart (dNN(i,i+3), dαN(i,i+3), dβN(i,i+3)) were mainly observed at the amelogenin N-terminus.

