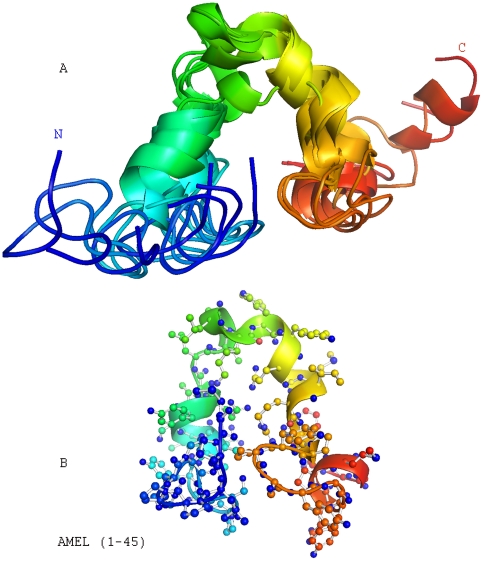
Figure 4. Solution NMR structure of the amelogenin TRAP region (AA1-45).
A, Structural diagrams based on backbone traces from 6 selected conformers with lowest target functions calculated using the DYANA software program. Superimposed conformers from amelogenin TRAP region (AA1-45). B, Ribbon diagram representation of amelogenin TRAP region structure. The two regions (S9-V19) and (K24-I30) adopted α-helix like secondary structure and interacted with each other through Y17 and W25 side-chains. The region between V19-L23 formed a turn.

