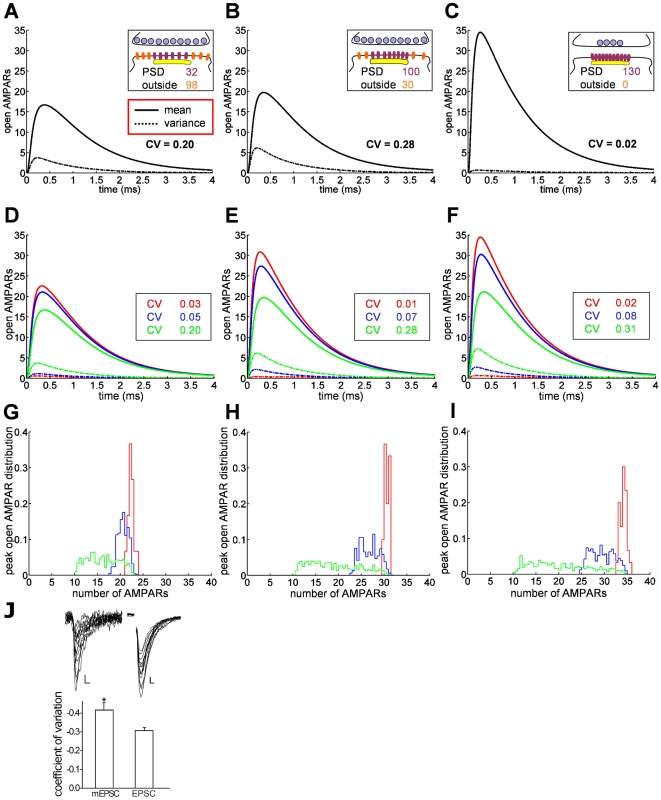
Figure 4. Increased efficiency of synaptic transmission by alignment of release sites and receptors.
Figures (A) to (F) show the mean (solid line) and variance (dashed) of the number of open AMPARs for different configurations of vesicle release sites and AMPARs: (A) for vesicle release sites and AMPARs uniformly distributed (UD) over AZ and PSD, respectively, (B) for UD release sites but AMPARs clustered at the PSD, (C) for release sites and AMPARs clustered at the AZ center and the PSD, respectively. In that case, the CV is divided by 10, while the mean number of peak open AMPARs increases from 15 to 20 to 35. (D–F) The number of AMPARs for different release distributions (red: release in the center of the AZ; blue: release sites UD over PSD; green: release sites UD over the presynaptic terminal). (G–I) The distributions of the number of peak open AMPARs, corresponding to the different release site and receptor localizations. (J) The coefficient of variation of AMPAR-mediated peak amplitudes of miniature EPSCs (n = 8) is larger compared to evoked EPSCs (n = 15, P 0.01). Representative sample traces of AMPAR-EPSCs (Scale bar, 10 pA, 5 ms) and mEPSCs (Scale bar, 5 pA, 5 ms) are shown above the respective bars.

