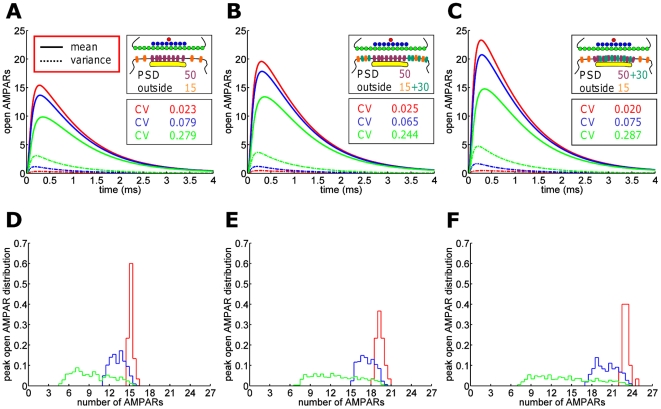
Figure 5. Increase in AMPAR density following long term potentiation.
(A–C) An equilibrated synapse (A) transits, by extrasynaptic AMPAR insertion (B), to a synapse with an increased number of PSD-based AMPARs (C). Insertion of receptors leads to a 27% increase in the number of open AMPARs (B). Translocation of these receptors to the PSD results in a further 23% increase (C). This transition can be viewed as a two-step process following LTP where at the beginning receptors are apposed to the presynaptic area but are not inside the PSD. (D–F) The distribution of the synaptic response corresponding to the synaptic settings of (A), (B), (C), where (D) corresponds to (A). Three different release site distributions were simulated: release at the the AZ center (red); release sites uniformly distributed over the AZ (blue); release sites uniformly distributed over the entire presynaptic terminal (green). The current variation is more reduced for release at the AZ center or for a small active zone compared to a uniform release. (Glial transporter density: 5,000 .).
.).

