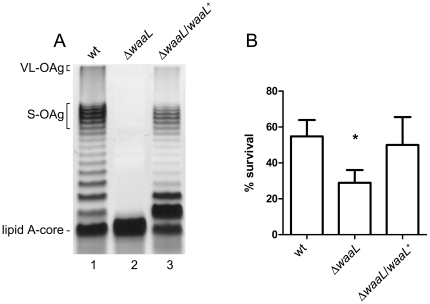
Figure 1. Contribution of the O antigen to S. flexneri 2a acid resistance.
LPS profiles (A) and acid resistance (B) of S. flexneri 2457T (wt), MSF1210 (ΔwaaL) and MSF1210/pMM112 (ΔwaaL/waaL +). LPS samples from equal numbers of bacterial cells (1×10⁷ CFU) were loaded in each lane and were analyzed by Tricine-SDS-polyacrylamide gel electrophoresis on a 14% (w/v) acrylamide gel followed by silver staining. Brackets indicate the VL-OAg, the S-OAg and the lipid A-core region. For acid resistance assays, cells were grown overnight in citrate-buffered LB (pH 5.5) and diluted 1∶1000 into the acid-challenge media. Survival is stated as a percentage of the inoculum. Averages±standard errors (error bars) are shown. Statistical significance was determined by a Student's t test. (*, P <0.05).

