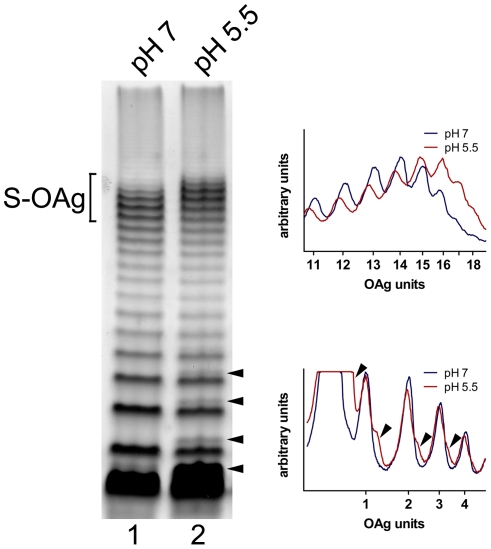
Figure 4. Effect of pH on LPS profiles from S. flexneri 2457T.
Cells were grown at pH 7.0 or 5.5 and LPS samples were obtained. LPS samples from equal numbers of bacterial cells (1×10⁷ CFU) were loaded in each lane and were analyzed by Tricine-SDS-polyacrylamide gel electrophoresis on a 14% (w/v) acrylamide gel followed by silver staining. Bracket shows the S-OAg region. Arrow heads point to the double bands observed in LPS from bacteria grown at pH 5.5. The right panels show the densitograms of the bands in the gel. Upper graph shows the bands corresponding to the S-OAg (11 to 18 units) and lower graph shows the bands corresponding to the Lipid A-core substituted with 1 to 4 units.

