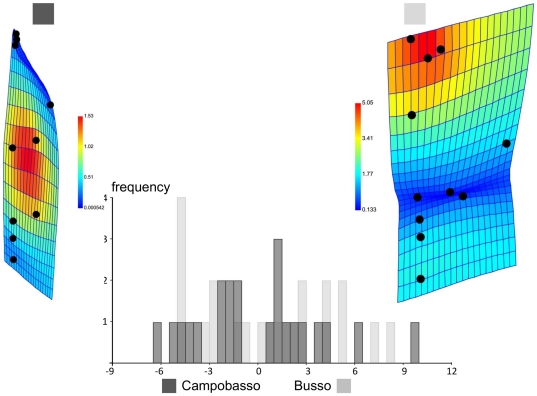
Figure 8. Discriminant analysis of geographic populations using leaf shape after averaging within trees.
Same differences as in Figure 6 (printed black and white version) visualized in PAST using TPS deformation grids and colour coded Jacobian expansion factors which measure the degree of local expansion or contraction of the grid: yellow to orange red for factors >1, indicating expansions; light to dark blue for factors between 0 and 1, indicating contractions).

