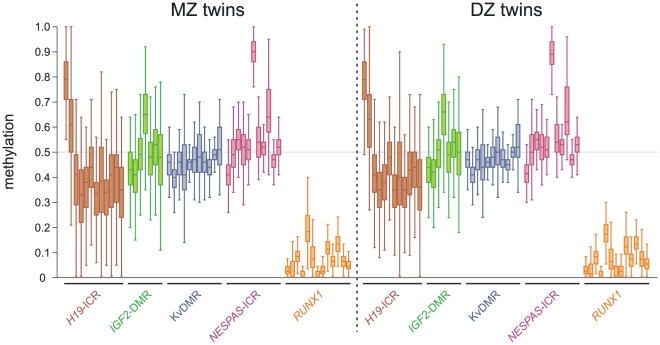
Figure 2. DNA methylation levels at four imprinted loci and the RUNX1 promoter in MZ and DZ twins.
Box plot results of the DNA methylation levels are shown per CpG unit as determined by MALDI-TOF mass spectrometry. Each box plot shows the distribution of DNA methylation in 256 monozygotic (MZ) or dizygotic (DZ) individuals (left or right panel, respectively; brown: H19-ICR; green: IGF2-DMR; blue: KvDMR; pink: NESPAS-ICR; orange: RUNX1).

