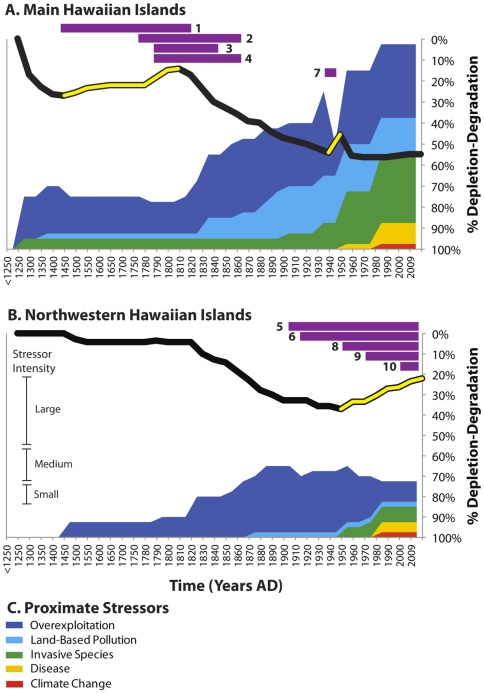
Figure 3. Trajectories of change in coral reef ecosystems in the Main Hawaiian Islands (MHI) (A) and the Northwestern Hawaiian Islands (NWHI) (B).
Ecosystem trendlines (in black) represent averages of changes in relative abundance in 7 trophic guilds (Figure 2). Periods of reef recovery in the MHI (AD 1450–1800) and the NWHI (AD 1950–2009) are indicated where the trendline is yellow. Proximate human stressors (C), indicated as colored regions, are quantified on a scale of intensity (see Methods). Recovery factors are represented by purple bars and reference column D on Table 1. Proximate stressors exhibit an inverse relationship with ecosystem condition on an axis of depletion-degradation. Time is represented on the horizontal axes (AD 1250–2009); 50-year increments are used in the prehistoric period (AD 1250–1778) and 10-year increments are used for the historic and modern period (AD 1778–2009).

