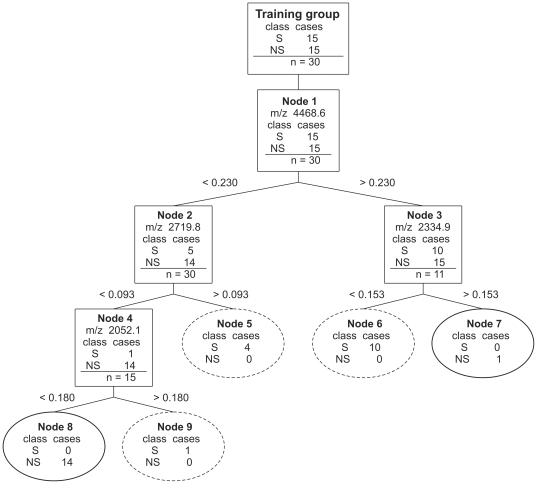
Figure 4. Best classification tree for the training group using MALDI-ToF MS data from BALF.
Four cluster masses (mass peaks) were used to construct the tree (m/z, 4468.6, 2719.8, 2052.1 and 2334.9). The nodes were sequentially labelled on the basis of the branching level and show splitting criteria. As an example, m/z 4468.6<0.230 means that BALF with peak intensities lower than 0.230 at m/z, 4468.6 are allocated to the left branch and all other BALF to the right branch. BALF continue down the tree until they reach a terminal node depicted as ellipses. Ellipses with full lines denote terminal nodes of nonsurvivors. The number of BALF at each node are given for both survivors (S) and nonsurvivors (NS). The tree classifies all patients correctly, however, accuracy decreased to 76.7% after 10-fold cross validation.

