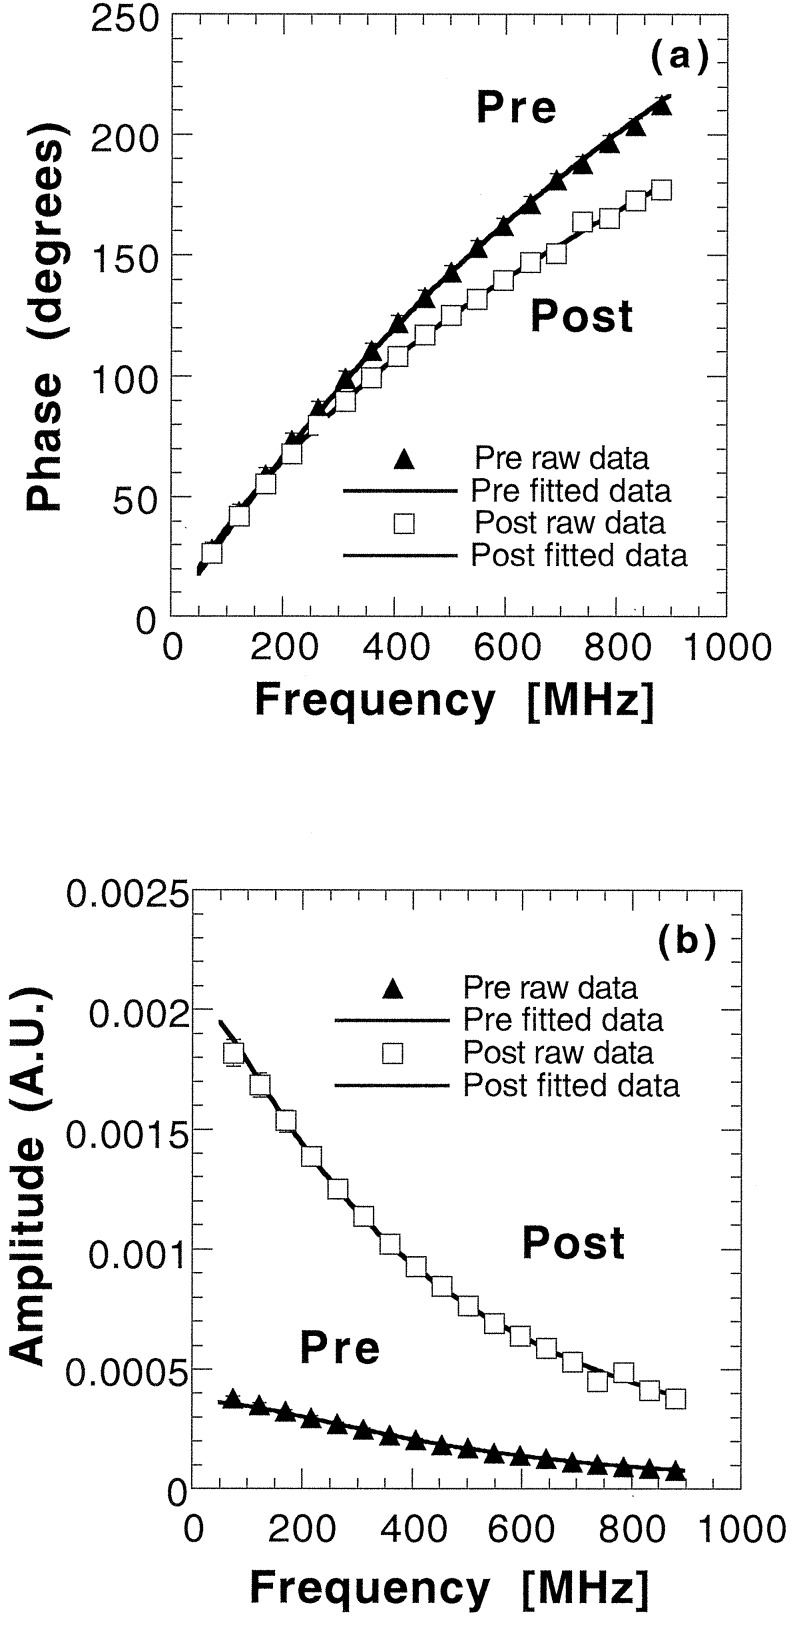
Figure 2.
FDPM measurements of phase lag (a) and amplitude vs. modulation frequency (b) for Pre 1 and Post 1. Source-detector separation, 2.5 cm; wavelength, 849 nm. Solid lines represent best diffusion-model function fits to phase and amplitude data for each subject. Error bars are on the order of the marker size.

