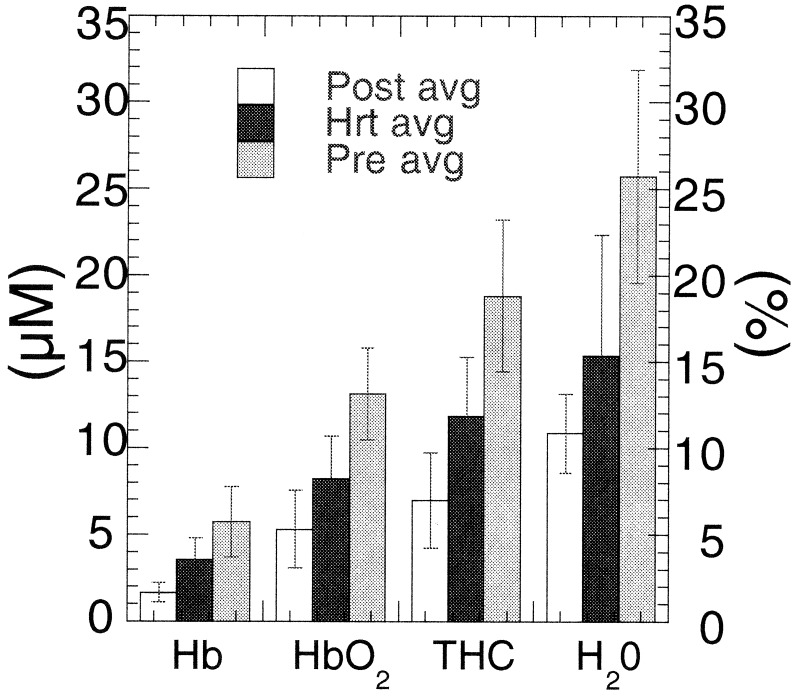
Figure 6.
Mean Hb concentrations [μM, HbO2, deoxy, and total (THC)] and water (H2O) concentration relative to pure water (%) for each subject group. Values are determined from wavelength-dependent absorption values at 674, 803, 849, and 956 or 980 nm. Error bars represent the normalized standard deviation to the mean for six premenopausal, five HRT, and three postmenopausal subjects. Confidence values are ≈99% for Hb, HbO2, THC, and H2O.

