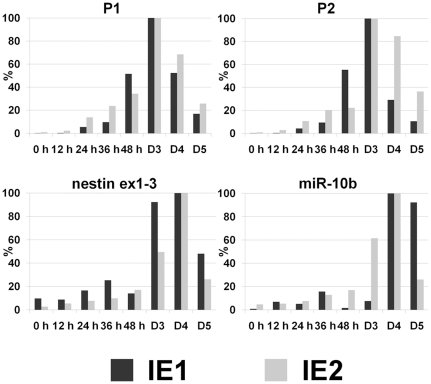
Figure 2. Expression profiles of Hoxd4 P1, P2 and miR-10b in differentiating P19 cells.
qRT-PCR was carried out on cDNA derived from P19 cells undergoing neural differentiation. The levels of the transcripts were arbitrarily assigned 100% at the time point where they peaked. Transcripts of nestin, a marker of neural differentiation, accumulated with time during P19 differentiation, peaking by day 4 (D4). miR-10b expression was induced together with Hoxd4 P1 and P2 transcripts and likewise peaked on day 4 (D4). P1, P2 and nestin were normalized to 18S RNA; miR-10b was normalized to U6 snoRNA. For specific detection of P2 transcripts only, or P1 plus P2 transcripts, primers were designed to amplify regions of approximately 200 bp whose positions are shown in figure 1B. Data represent two independent experiments, each shown as the average of qPCR technical duplicates. Dark grey bars: independent experiment 1 (IE 1); light grey bars: independent experiment 2 (IE 2).

