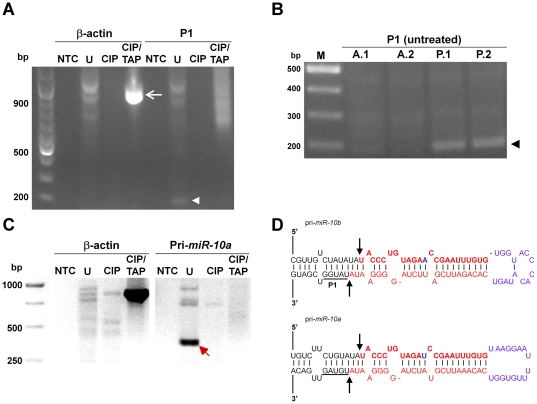
Figure 3. Hoxd4 P1 transcripts are generated by Drosha cleavage.
(A) Presence of uncapped P1 transcripts. The untreated sample (U) gave an approximately 188 bp amplification product (arrowhead). As a positive control, an expected 900 bp product from β-actin is amplified only when the RNA has been treated with CIP and then TAP (arrow). NTC: no template control; U: untreated RNA; CIP: CIP-treated RNA; CIP/TAP: CIP and TAP-treated RNA. (B) Uncapped P1 transcripts are present only in posterior tissues of the mouse embryo. Untreated (U) RNA from the posterior tissues of two different mouse embryos (P.1, P.2) gave a 188 bp amplification product by RT-PCR that corresponds to the presence of uncapped P1 transcripts (black arrowhead). This band is at background levels in anterior tissues of two mouse embryos (A.1, A.2) where Hoxd4 is not expressed. M: molecular weight markers. (C) Presence of uncapped Hoxb4 transcripts. The untreated sample (U) gave a 300 bp amplification product (red arrow), indicating the presence of an uncapped Hoxb4 transcript. Image is the negative of the ethidium bromide stained gel. (D) Drosha cleavage site of pri-miR-10b and -10a. The nucleotides in red show the miRNA duplex formed by the mature miR-10b/a (top strand) and miR-10b/a* (bottom strand) sequence. Black arrows show the Drosha cleavage sites on the pri-miR-10b/a hairpin. The cleavage site is exactly 11 bp from the bottom of both the pri-miR-10b and pri-miR-10a stem junction on the downstream side. This is within a single nucleotide of the previously mapped P1 start site (a cluster of 4 nt underlined and denoted “P1” on pri-miR-10b).

