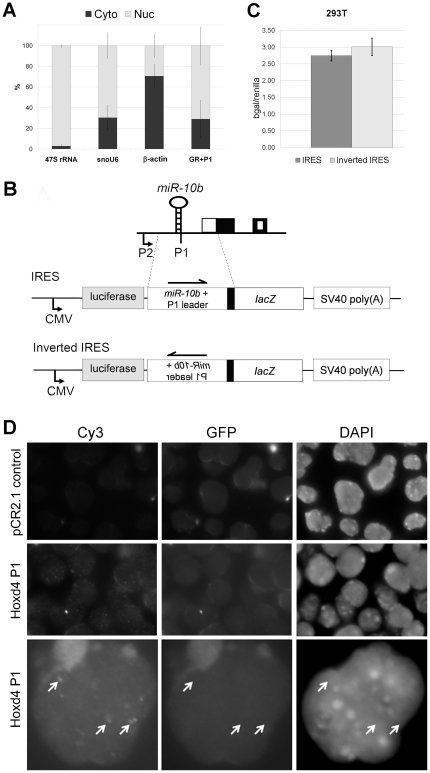
Figure 5. Drosha-cleaved P1 transcripts are not translated and are localized to punctate nuclear bodies.
(A) qRT-PCR of transcripts in nuclear (Nuc, light grey bars) and cytoplasmic (Cyto, dark grey bars) fractions of P19 cells on day 3 of differentiation. 47S pre-rRNA and snoU6 RNA served as positive controls which were enriched in the nuclear fraction while β-actin mRNA was more abundant in the cytoplasmic fraction. Almost three-quarters of the total Drosha-cleaved P1 transcripts (white) detected were present in the nuclear fraction. Data shown represent the mean of experimental triplicates, and error bars are plotted as the percentage of the standard deviation to mean. (B) IRES reporter assay in 293T cells. The activity of the IRES construct is not significantly higher than the control inverted IRES construct in either 293T cells. β-gal activity was first normalized to renilla luciferase activity. Data shown represent the mean of experimental triplicates, and error bars give standard deviation. (C) Schematic of the IRES and control reporter constructs. The IRES test construct consists of the luciferase cassette driven by a CMV promoter, followed by the P1 putative IRES region in front of the lacZ gene and SV40 polyadenylation signal. The inverted IRES construct consists of the same components except that the putative IRES region, which is about 1 kb in length, is inverted. Boxes indicate exons as per figure 1B. (D) RNA FISH of P19 cells on day 3 of neural differentiation. Vertical columns show images obtained under excitation for Cy3, GFP and DAPI. Images obtained with excitation for GFP control for autofluorescence. The upper row shows a negative control Cy3-labelled probe (pCR2.1 control) and the middle and lower rows show the localization of the Cy3-labelled Hoxd4 P1 probe (Hoxd4 P1). Hoxd4 transcripts are specifically detected as speckles in the nucleus of neurally differentiated P19 cells. Images in the bottom row have been digitally enlarged in order to present the punctate bodies more clearly. The Adobe Photoshop application was used to enhance the contrast simultaneously to pairs of images in the Cy3 and GFP columns. Arrows denote punctate bodies visible with the Cy3-labelled Hoxd4 P1 probe. These bodies are not visible when the sample is excited for GFP and do not correspond to chromatin structures detected by DAPI.

