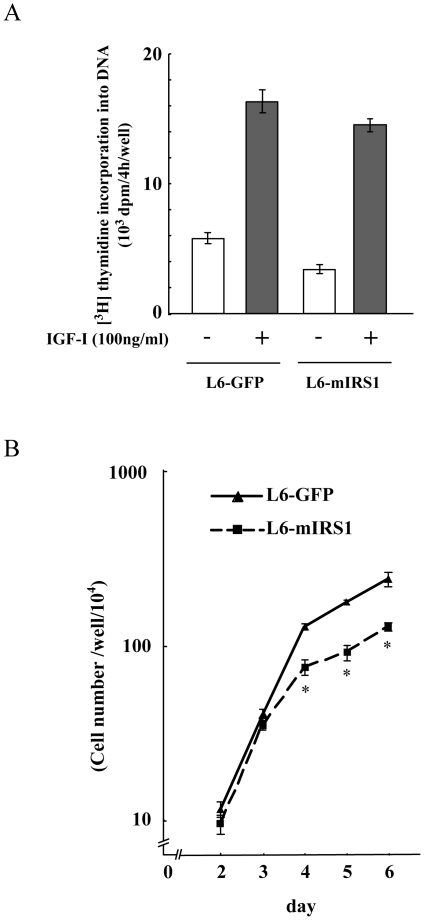
Figure 2. Effects of IRS-1 constitutive expression on cell growth.
A: [Methyl-3H] thymidine incorporation into DNA was measured during the last 4 h of IGF-I treatment time. The mean ± SEM of three replicate dishes is shown. B: 3×10³ cells of L6-GFP control or L6-mIRS1 cells were inoculated in 35 mm dishes. Cells were grown in DMEM containing 10% FBS and cell number was counted in each day. *, difference between L6-GFP control cells and L6-mIRS1 cells is significant with p<0.05.

