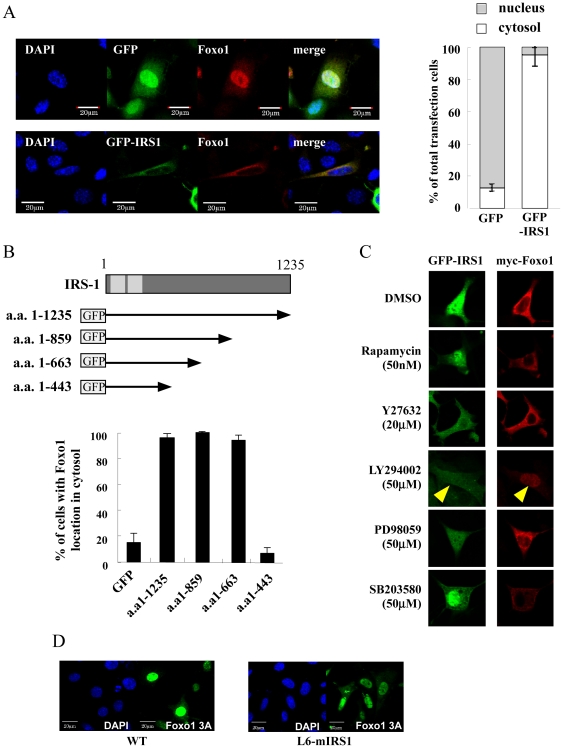
Figure 4. Effects of IRS-1 expression on Foxo1 localization.
A: L6 myoblasts were transfected with pGFP or pGFP-IRS1 along with pmyc-FoxoH215R. Eighteen hours after transfection, cells were fixed and immunostained with myc antibody. Foxo1 localization was shown in red. Among the GFP or GFP-IRS1 expressing cells, percentage of cells with myc red signals in the cytosol was calculated and shown in the right graph. Values are the mean ± SEM of at least three different experiments. B: Schematic structure of IRS-1 was shown. Below this, series of IRS-1 deletion constructs fused with GFP were shown. L6 myoblasts were transfected with plasmids expressing series of IRS-1 deletion constructs along with plasmids expressing myc-FoxoH215R. Percentage of Foxo1 cytosolic localization was shown in the graph. Values are the mean ± SEM of at least three different experiments. C: L6 myoblasts were transfected with pGFP-IRS1 along with pmyc-FoxoH215R. One day after transfection, indicated inhibitor was added into the medium. One day after inhibitor addition, cells were fixed and immunostained with anti-myc antibody. GFP-IRS1 localization was shown in green and Foxo1 localization was shown in red. D: L6 cells or L6-mIRS1 cells were transfected with pGFP-Foxo1 3A. Cells were fixed and stained with DAPI. Nuclear staining is shown in blue and Foxo1 3A is shown in green.

