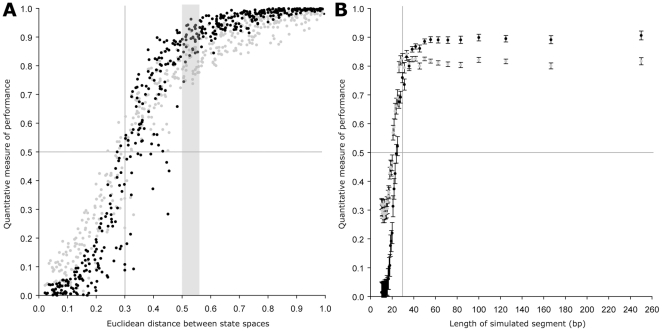
Figure 1. Testing the performance of the Bayesian segmentation method to changes in nucleotide composition and sequence length.
A) The effect of state space difference on precision and recall of the Bayesian segmentation method to identify multiple change points in sequence composition for a fixed segment length. Grey dots represent the precision score black dots represent the recall score. The shaded area (0.50–0.55) indicates the interval chosen for further analysis in part B. B) The effect of segment length on the precision and recall performance of the method to identify change points in sequence composition for a set interval of state space difference. Grey dots represent the mean precision score, and black dots represent the mean recall score for 100 replicates made at each segment length. Error bars indicate 1 standard error of the mean.

