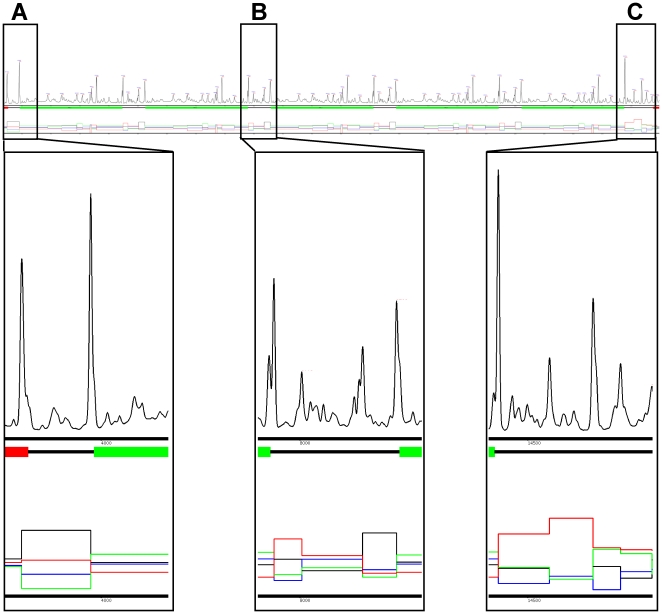
Figure 2. The Trypanosoma brucei PFR1 gene array on chromosome 3.
Directly underneath the profile a box diagram of the genes is indicted with the PFR1 genes coloured in green and the up- and downstream genes coloured in red, intergenic regions are indicated by a black line. Underneath this the base composition of the segments is shown as a line chart where the red line represents the frequency of T residues, the black line represents the frequency of A residues, the blue line represents the frequency of C residues and the green line represents the frequency of G residues observed in the region between peaks. A) The 5′ end of the gene array. B) The region between two PFR1 coding sequences. C) The 3′ end of the gene array.

