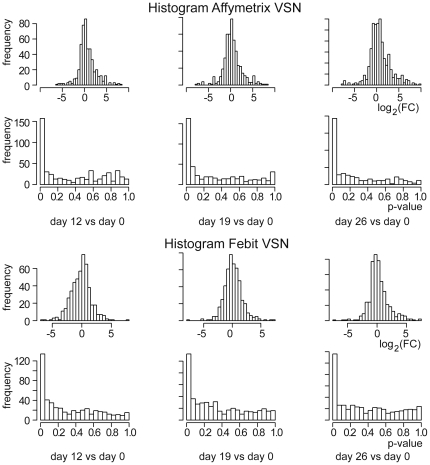
Figure 4. Comparison of microarray data dependent on platform used.
Histograms of the log2 fold changes and adjusted p-values of comparisons between differentiated Cor.At® cardiomyocytes and undifferentiated ES cells for microarray data from Affymetrix (upper part) and Febit (lower part). The comparisons are day 12 vs. day 0, day 19 vs. day 0 and day 26 vs. day 0 (from left to right).

