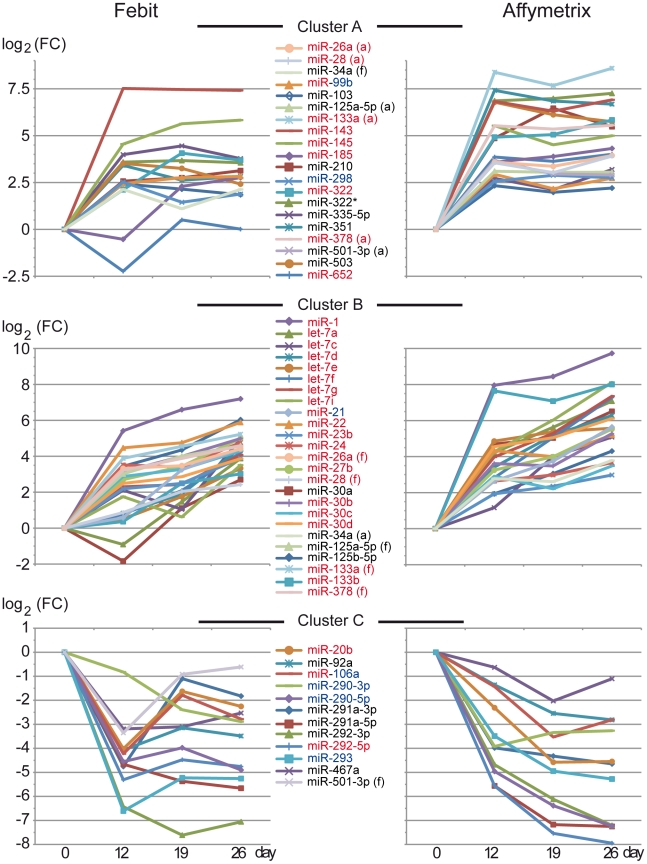
Figure 9. Changes in expression of selected miRNAs during time course of cardiomyocyte-specific differentiation/maturation.
Three expression clusters of the 50 platform and pre-processing methods independent regulated miRNAs. (Cluster A) miRNAs which increased at day 12 and keep highly expressed afterwards, (Cluster B) miRNAs which incease continuously, (Cluster C) miRNAs which are down regulated during differentiation. miRNA names are colored in red for according to literature cardiac-related miRNAs and blue for according to literature ES cell related miRNAs. Y-axis represents log2 fold change over undifferentiated ES cells (day 0). miRNAs showing discrepancies in cluster membership dependent on array platform are marked with (a) for the Affymetrix and (f) for the febit result.

