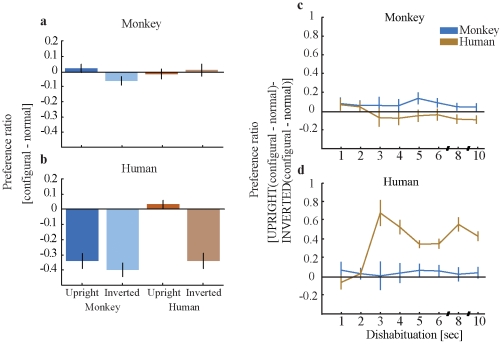
Figure 2. Preference for the face picture above the blank (preference ratio).
(a–b) show the grand mean of the difference in preference ratio for configurally manipulated versus normal faces (y-axis) as a function of stimulus species (human versus monkey) and presentation condition (upright versus inverted) (x-axis). Subtitles indicate the species affiliation of the observers. Time course of preference ratio. (c) and (d) show the subtracted values (preference ratio) of the differences between upright configural and normal faces and inverted configural and normal faces as a function of time (sec). The stimulus species is indicated by the line color, the species affiliation of the observers by the subtitles.

