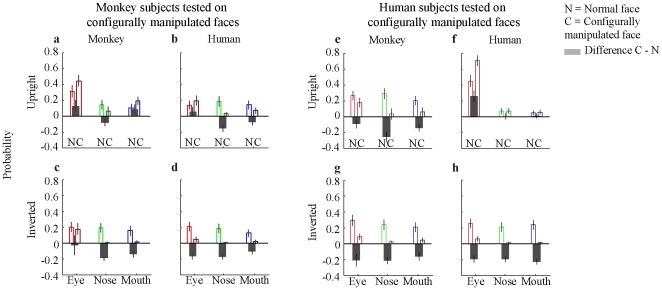
Figure 3. Viewing times of humans and monkeys tested on configurally manipulated faces.
Shown are the grand means of looking time, i.e. the time which the observer spent looking at a specific part normalized to the overall looking time and the size of the specific parts. The bars indicate the probability of looking at eyes (red), nose (green) and mouth (blue). ‘N’ stands for the normal face, ‘C’ for the configurally manipulated face. The gray bars show the difference between configurally manipulated and normal faces. a, b, e, f show the upright, c, d, g, h the inverted presentation condition. The subtitles indicate the species of the stimuli. The zero line indicates a random gaze distribution. Values above 0 are of higher probability than random; everything below 0 is of lower probability than random.

