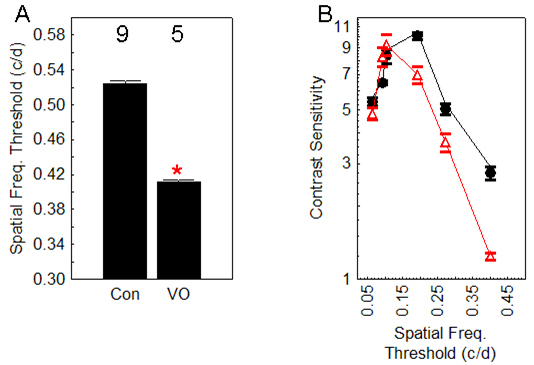
Figure 3.

Summary of visual performance in variable oxygen exposed Long Evans rats. A: Spatial frequency threshold in control (con) and variable oxygen (VO) rats. The numbers above the bars represent the number of animals in each group. Error bars represent the standard error of the mean (SEM). The * indicates a significant (p<0.05) difference from control values. B: Contrast sensitivity in same two groups as A; circle=con, triangle=VO. These two curves are significantly different (ANOVA, p<0.05).
