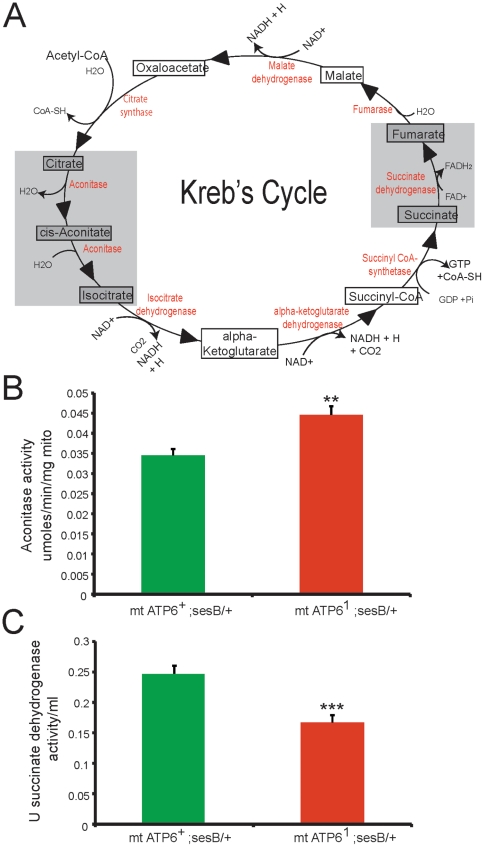
Figure 6. Succinate dehydrogenase and aconitase enzyme activity measurements.
A) Kreb's cycle pathway; intermediates shown in boxes, enzymes shown in red. Gray boxes represent steps where enzyme activity level was measured in isolated mitochondria. B) Aconitase activity measured in wildtype (green) and ATP61 (red) mitochondria. ATP61 mitochondria have increased aconitase activity compared to wildtype. N = 15 per genotype (0–100 ug mitochondria). Error is S.E.M. Statistical analysis is student's t-test. C) Succinate dehydrogenase activity measured in wildtype (green) and ATP61 (red) mitochondria. ATP61 mitochondria have reduced succinate dehydrogenase activity compared to wildtype. N = 9 per genotype. Error is S.E.M. Statistical analysis is student's t-test.

