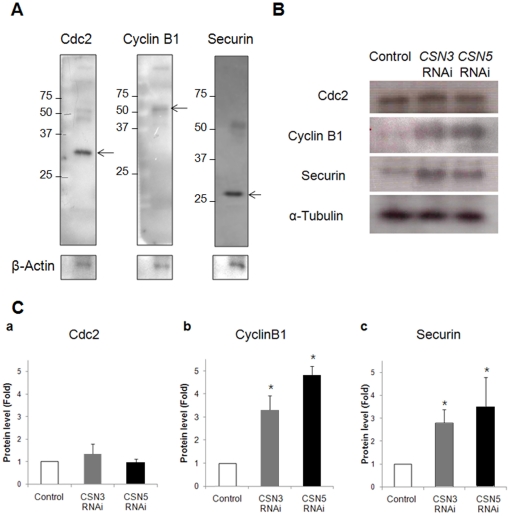
Figure 8. The level of APC/C substrates changed following CSN3 or CSN5 knockdown.
(A) Western blot analysis of Cdc2, Cyclin B1, and Securin by using 100 oocytes. Numbers on the left side of the band indicate the sizes (kDa) of the protein markers, while arrows indicate the specific proteins. (B) Western blot analysis of Cdc2, Cyclin B1, and Securin by using 100 oocytes. (C) Relative protein level of each band was calculated and presented as the mean ± SEM by measuring the area and data are presented in comparison to appropriate control bands for each protein. Asterisks indicate statistically significant differences compared to control group (p<0.05).

