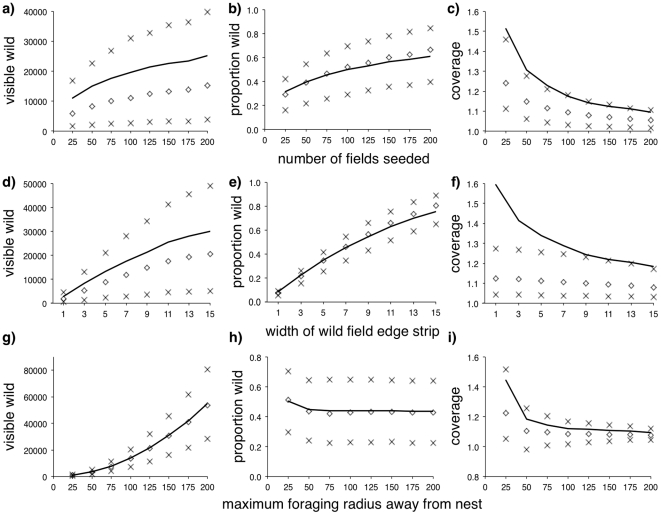
Figure 2. Wild forage available within Voronoi-like randomised fields.
Solid black line gives mean values and symbols give the 25%, median and 75% interquartile values for the mean number of visible wild field edge cells (‘visible wild’, panels a, d and g) and the proportion of wild field-edge cells to cultivated field cells within the foraging radius (‘proportion wild’, panels b, e and h), and the ratio of the proportion of field edge cells visible within the foraging distance of the nest compared with the overall proportion of edge to field cells within the simulated arena (‘coverage’, panels c, f and i), where the number of fields seeded (panels a, b, and c), the width of the wild field edge strip (panels d, e, and f), or the radius of the foraging distance around the nest (panels g, h, and i) are systematically altered.

