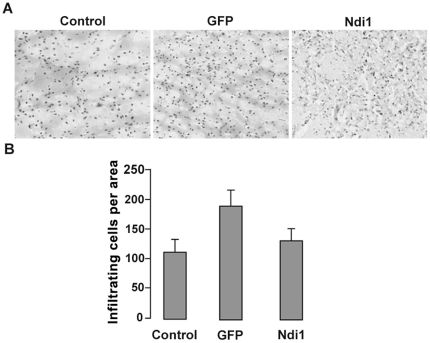
Figure 2. Evaluation of infiltrated cells in the rat brain.
Rats were injected with PBS (control), rAAV-GFP, or rAAV-NDI1 in the striatum of rat brain. The brain samples were collected 1 month post-injection. (A) Representative images of brain sections from each group after H&E staining. (B) Comparison of the number of infiltrated cells. The histogram shows the number of infiltrating cells per field of view in the sections separated by at least 90 µm (n = 4 for rats, n = 6 for brain sections from each animal). Results are expressed as mean ± SD. ** p<0.01 and * p<0.05 from the respective control (Student's t-test).

