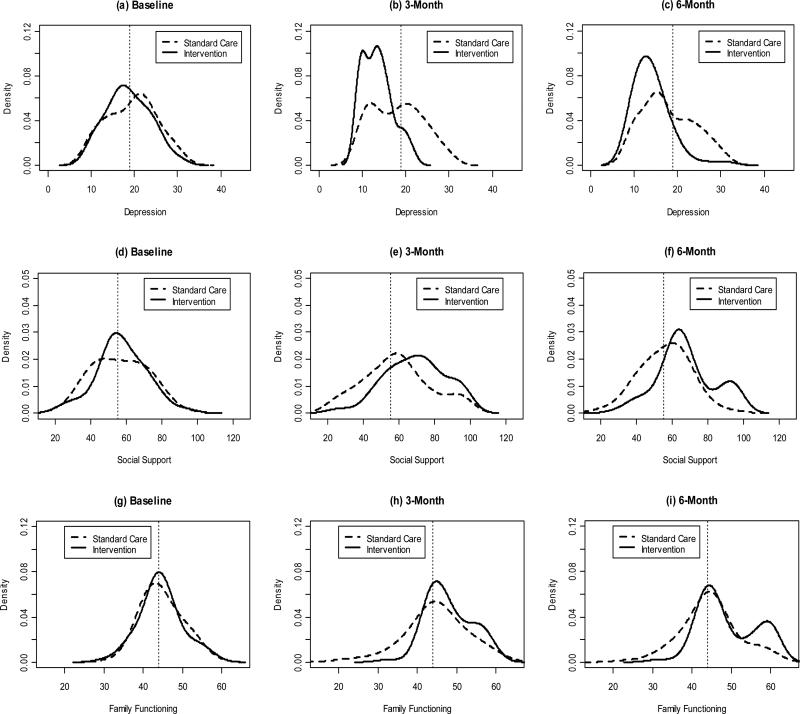
FIGURE 2.
Kernel density curves for depression (top row), social support (middle row), and family functioning (bottom row) by group at baseline (first column), 3-month follow-up (second column), and 6-month follow-up (third column). Solid curve represents intervention and dashed curve represents control. The vertical dashed line represents the median score at baseline.

