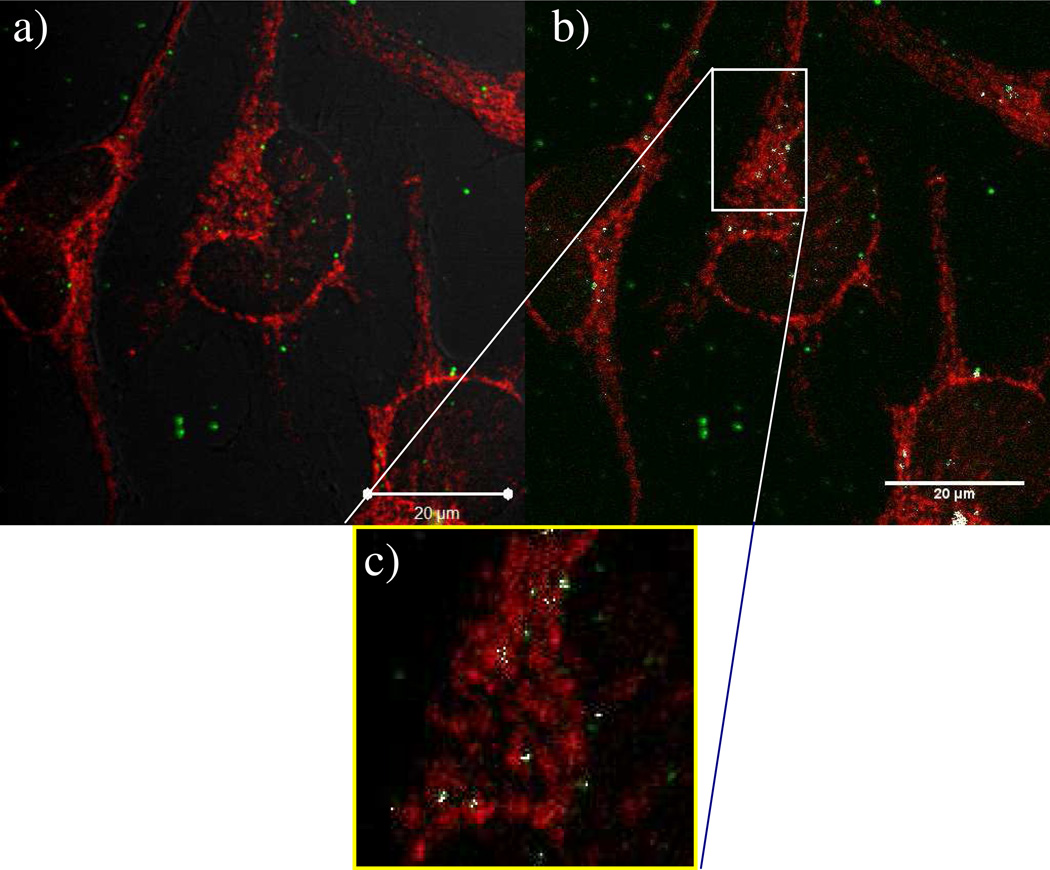
Figure 4.
Confocal microscopy images of HeLa cells transfected with PEI polyplexes (shown as green from labeled pDNA) showing overlap with mitochondria (red). The cells were fixed one hour after transfection. (a) Image of whole cells transfected with PEI polyplexes. (b) Highlighting colocalized pixels; mitochondria are shown as red, polyplexes are shown as green, and colocalized pixels are shown as white. The Mander’s coefficient (M1) for the amount of green overlapping red was found to be 0.349. (c) Close up view from inside the box in (b) to further highlight colocalization between polyplexes and mitochondria. Scale bar = 20 µm.

