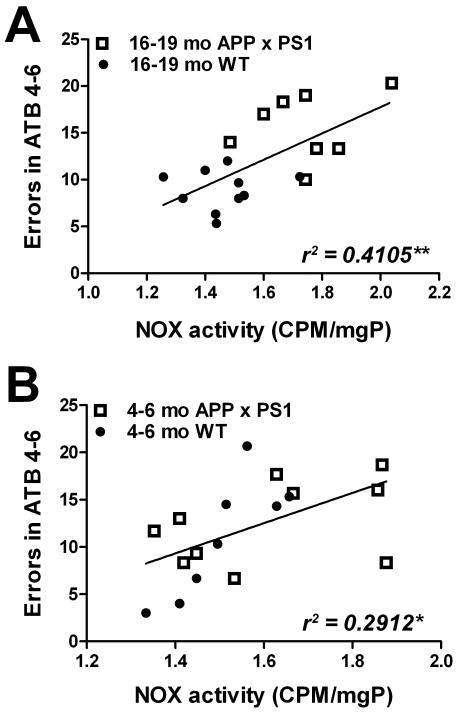
Figure 5. Linear relationship between maze performance and NOX activity in young and aged WT and APP × PS1 mice.
(A) Scatter plots show the relationship between errors in acquisition trail block 4-6 (errors in ATB 4-6) and NOX activity in aged (16-19 month-old) APP × PS1 (open squares) and WT (closed circles) mice. Each point represents an individual subject, and the line depicts the degree of linear regression. (B) Scatter plots show the relationship between errors in acquisition trail block 4-6 (errors in ATB 4-6) and NOX activity in young (4-6 month-old) APP × PS1 (open squares) and WT (closed circles) mice. Each point represents an individual subject, and the line depicts the degree of linear regression.

