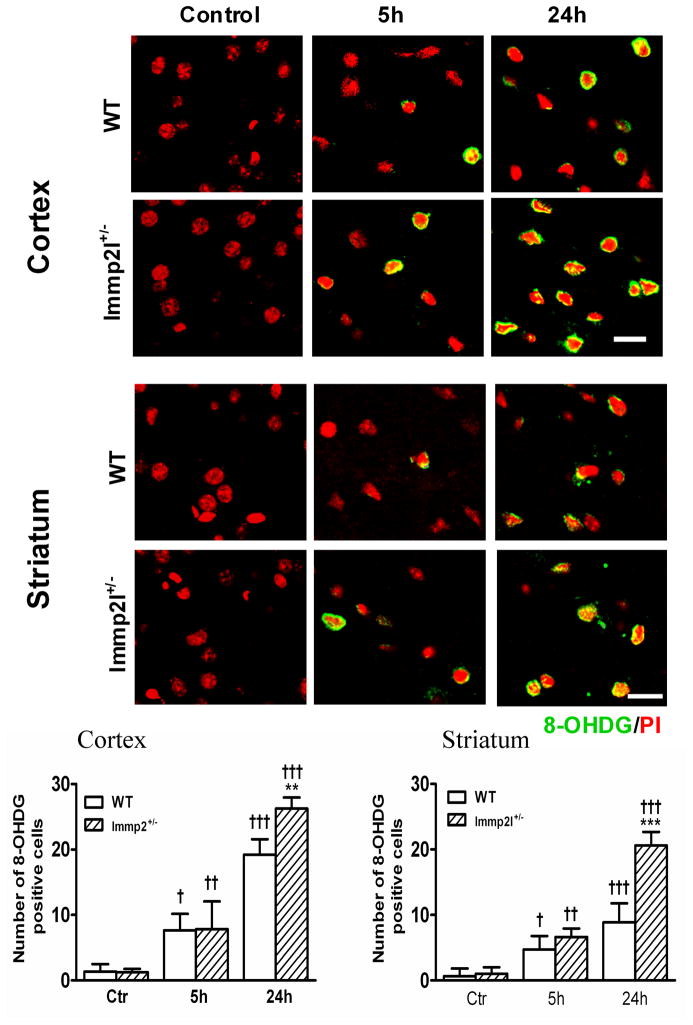
Fig. 4.
DNA oxidative damage detected by 8-OHdG immunohistochemistry. Fluorescent stainned brain sections show DNA oxidative damage in the cortex and striatum of the WT and Immp2l+/− mice. Animals were subjected to sham-operation (Control), or 1-h MCAO with 5- or 24-h of reperfusion (n=4 each group). Nuclei were labeled with propidium iodide (PI). Magnification, 400X. Scale bar = 50 μm. Bar graphs show the number of 8-OHdG positive cells per section in the cortex and striatum. Data are presented as means ± s.d. †P < 0.05, ††P < 0.01, †††P < 0.001 vs. sham-operated control in same type of animals, and **P < 0.01, ***P < 0.001 vs. WT at an identical time point.

