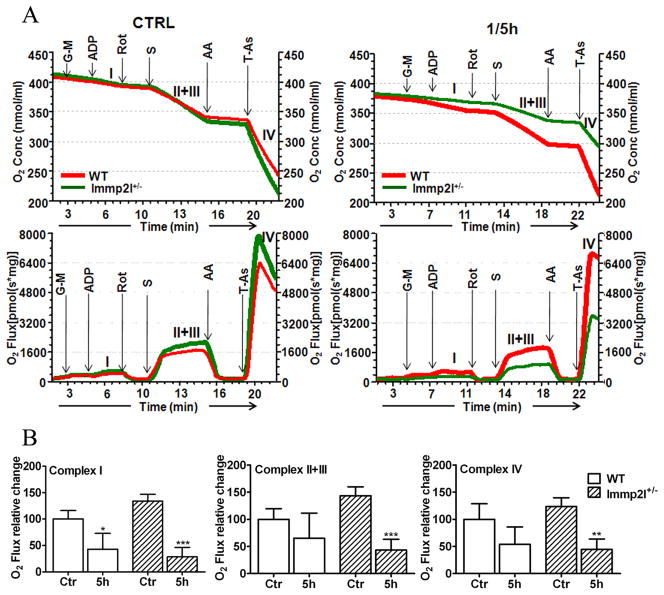
Fig. 5.
Mitochondrial respiratory rate at different complexes. A, Upper panel shows Oxygen consumption in control and 1-h MCAO plus 5-h reperfusion (1/5h) in FVB and Immp2l+/− mice brain mitochondria (n=3 each group). Lower panel shows the respiratory rate following addition of substrates. The respiration rate, hence oxygen utilization, was initiated by the addition of glutamate and malate (G-M) for complex I, succinate (S) and rotenone (rot) for complex II+III, and TMPD/ascorbate (T-As) and antimycin A (AA) for complex IV. The activity of each complex was calculated from the difference in reduction in oxygen content in the presence of specific substrate and specific inhibitor. B, Summarized data show activity of each complex in control (Ctr) and ischemia plus 5-h reperfusion (5h). Data are presented as means ± s.d. (n = 4 per time point). *P<0.05, **p<0.001 and ***p<0.001.

