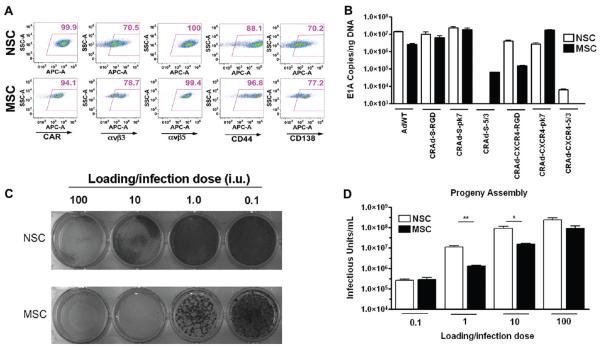
Figure 1.
Permissiveness of MSC and NSC for CRAd replication. (A) NSC and MSC were stained to detect the levels of Ad-targeted surface receptors. Numbers in top right corners of each dot plot represent the percentage of positive cells. Gates were drawn using an isotype control sample. y-Axis, SSC; x-axis, FITC-A. (B) Quantitative PCR detection of viral replication. NSC and MSC were infected with 1 IU of each vector. Seven days postinfection, the degree of viral genome amplification was assessed by measuring the number of viral E1A DNA copies/ng DNA. Bars represent mean of 3 experiments (standard error (SE). (C) CRAd-S-pk7 cytotoxicity in NSC and MSC. NSC or MSC were infected with CRAd-S-pk7 virus at the indicated iu and stained with crystal violet solution 7 days later. (D) Titration of infectious progeny assembly in NSC and MSC. Studies were conducted alongside crystal violet cytotoxicity studies. MSC were infected with CRAd-S-pk7 at the indicated MOI, and the number of infectious viral progeny was titrated 7 days later. ***, P-value <0.001; **, P-value <0.01; *, P-value <0.05.

