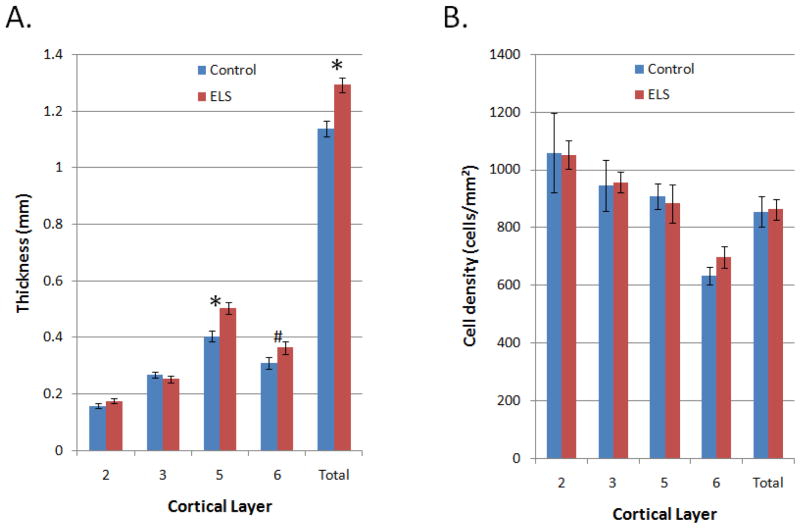
Figure 4.
PFC histology. Shown are group means ± SEM. (A). Compared to control rats (blue), ELS rats (red) showed thicker total PFC width (p<0.01), which was particularly prominent in the deeper layer V (p<0.01), along with a potential trend in layer VI (p=0.10). (B). No differences were seen in cell density among any of the layers.

