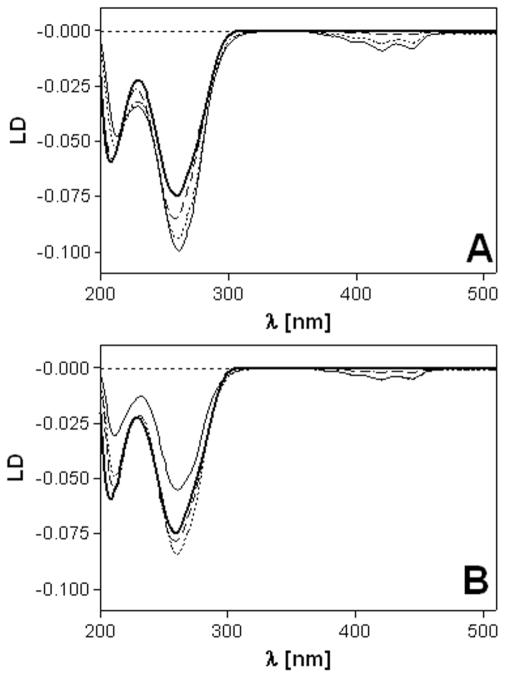
Figure 3.
Linear dichroism (LD) spectra of calf thymus DNA modified by 1 (A) and 2 (B). LD spectra were recorded for DNA in 10 mM NaClO4 with 10 mM sodium cacodylate, pH 7.0 at 25 °C. The concentration of DNA was 32 μg mL−1. Curves (A, B): bold solid line, control (unplatinated) DNA; dashed line, rb = 0.01; dotted line, rb = 0.05; solid line, rb = 0.08.

