
Fig. 3.
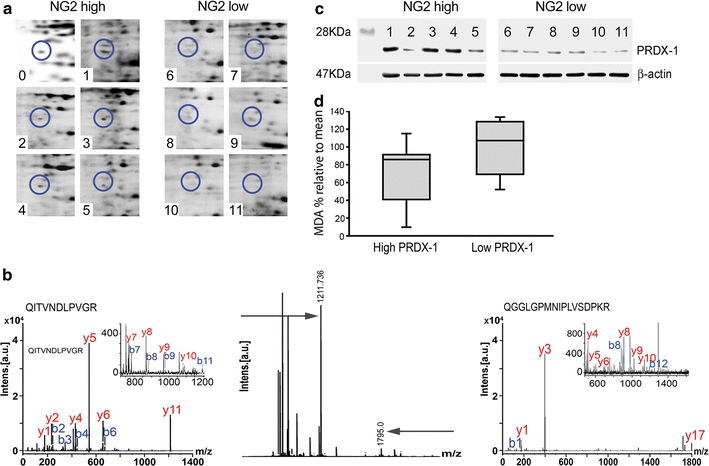
High PRDX-1 expression in patients with short survival outcomes associate with low lipid peroxidation. a 2D gel images of PRDX-1 from 11 patients’ GBM biopsies with high (blots 1–5) and low (blots 6–11) NG2 expression. Tumour numbers correspond to GBM patient biopsies, except for number 0, which is a master gel of all spots composed by PDQuest. b A Maldi TOF/MS of a tryptic digest of the protein spot identifying PRDX-1 (middle panel) and MS/MS spectra of two tryptic peptides (arrows) corresponding to PRDX-1 with a Mowse score of 198, where <56 was significant at p = 0.05, and sequence coverage of 60% (right and left panels). Inserts are zoomed regions of the MS/MS spectra of the peptides QITVNDLPVGR and QGGLGPMNIPLVSDPKR, where the y ions (red) and b ions (blue) are separated based on their mass to charge ratio (m/z) and the peak height represents the relative intensity of the ion peak. c Immunoblotting with anti-PRDX-1 antibodies in patient GBM biopsies used in the 2D gels shown. d MDA production (nmol/mg protein) in low versus high PRDX-1 expressing GBM biopsies. The data represent %MDA levels relative to the population mean. Data represent SEM, n = 23